
Carbon Neutrality and Financial Requirements in the Power Sector of the ASEAN
11/15 2025
Author: Youngho Chang
Carbon neutrality in the power sector of the ASEAN requires transition to non or little carbon-emitting electricity generation technologies with or without carbon capture and storage. An integrated power trade model of the ASEAN power sector presents various levels of carbon dioxide emissions under different assumptions on the levels of cross-border power trade, and the trajectory of carbon dioxide emissions suggests that the level of carbon dioxide emissions in the ASEAN powers sector should be limited to around 600 million tons, the level of carbon dioxide emissions in 2030 (Chang, 2024). This means that no or little carbon dioxide-emitting electricity generation technologies must be online from 2030 onwards.
The integrated power trade model of the ASEAN employs four scenarios – Business-As-Usual (NZT NT BAU), No cross-border power trade with carbon emissions capped at the level of 2030 (NZT NT 2030), Cross-border power trade up to 50% of domestic demand for each member country with carbon emissions capped at the level of 2030 (NZT T50 2030), and Cross-border power trade up to 80% of domestic demand for each member country with carbon emissions capped at the level of 2030 (NZT T80 2030). The reference scenario replicates the current cross-border transmission network in which no cross-border power trade takes place.
NZT NT 2030 scenario shows that the level of carbon emissions in the ASEAN power sector is expected to peak around 2036 and decrease afterward. Under the scenarios of cross-border power trade, NZT T50 2030 and NZT T80 2030, the levels of carbon emissions in the ASEAN power sector appear to be peak around 2030 although there is an offshoot in 2035 and 2037, respectively and show a fast-decreasing trend afterwards. This implies that more capacity for electricity generation must come from renewable energy sources. The study also presents various levels of added capacity in the ASEAN power sector to achieve net-zero transition by 2050, which in turn appear to incur significant financial requirements to achieve carbon neutrality in the ASEAN power sector.
The capital costs that are needed to realize the added capacity of electricity generation appear to decrease when cross-border power trade is allowed. The scenarios of NZT NT BAU and NZT NT 2030 present relatively higher capital costs for the added capacity of electricity generation compared to other two scenarios in which cross-border power trade is allowed. The capital costs of the added capacity of electricity generation are the lowest under the scenario of NZT T50 2030 followed by NZT T80 2030. The scenario in which cross-border power trade is allowed up to 50% of domestic electricity demand appears to dispatch more solar PV than hydropower to realize the net-zero transition in 2050. This in turn incurs lower capital costs. Figure 1 presents the trajectories of the capital costs of the added capacity of electricity generation by scenario from 2018 to 2050.
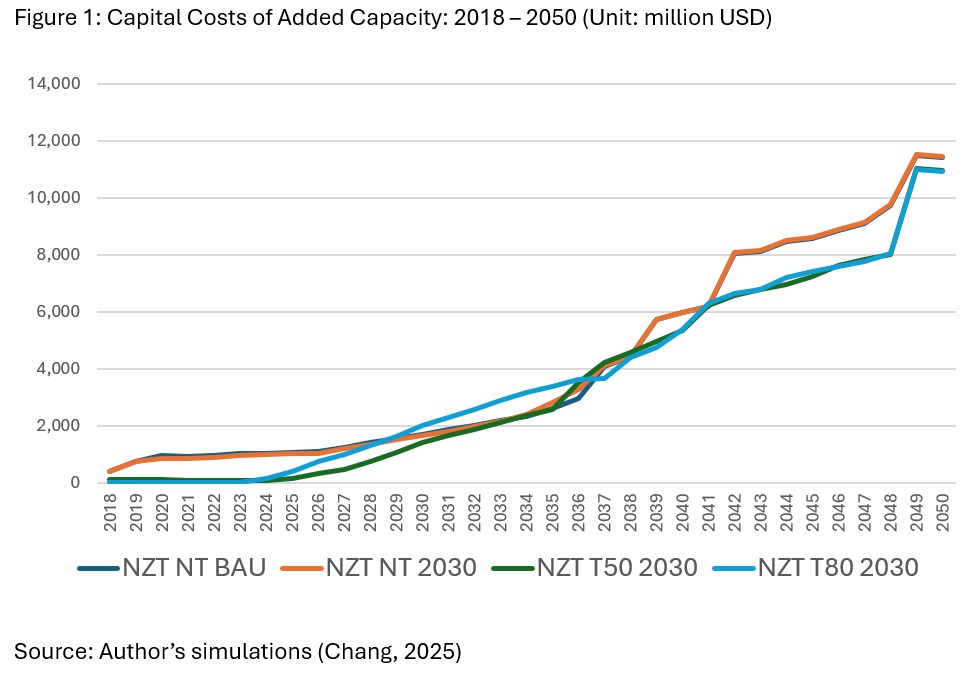
The ASEAN power sector is endowed with huge potential of renewable resources such as hydropower, wind and solar, and appears to have applicable power technologies to achieve net-zero transition by 2050. Solar PV and hydropower are two major technologies of the added capacities of electricity generation. The highest capital costs appear to be incurred for hydropower followed by solar PV.
The capital costs of added capacity of electricity generation under the scenario of NZT T80 2030 appear to be higher than those of the scenario NZT T50 2030 from 2024 to 2036 when more added capacity from hydropower is dispatched than solar PV. However, the difference is very small. Apart from solar PV and hydropower, the capital costs of electricity generation for other fuels are very low. This is mainly due to the fact that the majority of the added capacity of electricity generation is solar PV and hydropower.
Total system costs appear to decrease when cross-border power trade is allowed. Total system costs of the scenario NZT T80 2050 are the lowest while those of the scenario NZT NT BAU appear to be the highest. The higher the level of cross-border power trade is, the lower total system costs are as shown in figure 2.
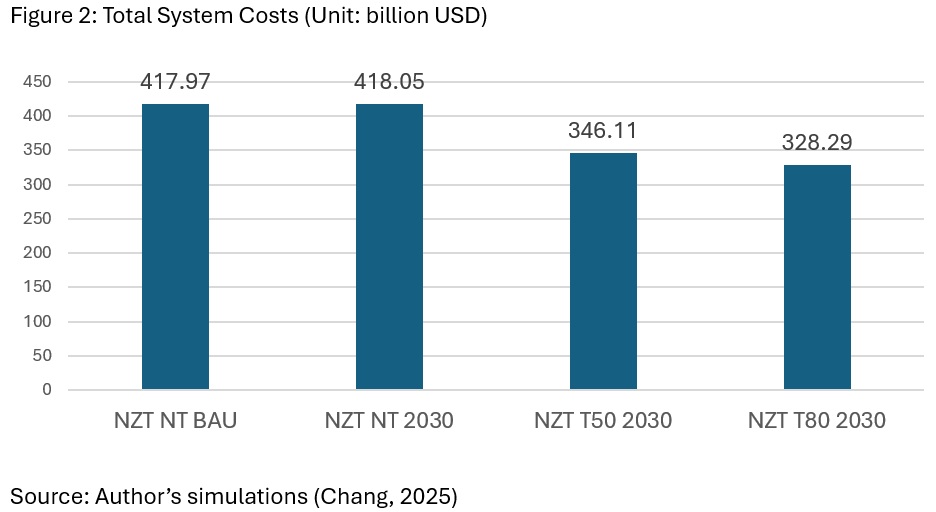
Overall higher levels of the added capacity of electricity generation from solar PV compared to hydropower under the scenario of NZT T80 2030 appear to make the total system costs the lowest among the four scenarios. However, the scenario of NZT T50 2030 presents the lowest capital costs of added capacity of electricity generation followed by NZT T80 2030. This is mainly due to the fact that the former appears to have a higher level of the added capacity of electricity generation from solar PV while the latter appears to have the highest level of the added capacity of electricity generation from hydropower that comes with a relatively higher capital costs, but a far lower carbon emissions coefficient compared to solar PV, which in turn makes the scenario of NZT T80 2030 the lowest in terms of total system costs and the level of carbon emissions.
References
Chang Y (2024) “Power Trade and Hydroelectricity Development in the Greater Mekong Sub-region: Perspectives on Economic and Environmental Implications,” in Economic Analysis of Large Deployment of Solar PV and Battery Storage in ASEAN edited by Han Phoumin, Rabindra Nepal, Fukunari Kimura and Farhad Taghizadeh-Hesary, Springer, pp. 55 – 77.
Chang Y (2025) “Financial Requirements for Carbon Neutrality in the Power Sector of the ASEAN,” in Green Finance and Energy Transition in ASEAN edited by Phoumin Han, Farhad Taghizadeh-Hesary, Fukunari Kimura and Rabindra Nepal, World Scientific (forthcoming).