
A Comprehensive Analysis of Participatory Budgeting in New York City
3/1 2026
Author: Takashi Kurihara
Participatory Budgeting (PB) is a mechanism through which citizens propose projects with cost estimates and vote to select the winning projects. The practice was introduced by Mayor Olívio Dutra in Porto Alegre, Brazil, in 1989 as a means of realizing participatory democracy. In recent years, PB has been studied by social choice theorists and computer scientists. This trend was notably highlighted at a pre-workshop held in conjunction with the 17th Social Choice and Welfare meeting in 2024.
To understand the PB process, consider a 100-million-yen budget with the following four submitted projects:
Project 1. Expansion of security cameras: 25 million yen
Project 2. Installation of laptops in primary schools: 10.5 million yen
Project 3. Improvement of hospital facilities: 75 million yen
Project 4. Hosting a local arts festival: 15 million yen Under the PB system based on approval voting, if Projects 1-4 receive 2, 1, 3, and 4 approvals respectively, then Projects 4 and 3 would be chosen in order of their approval counts, subject to the budget constraint.
How does PB work in the real world? This article utilizes data from Cycle 7 of New York City’s PB (source: New York City Council, Participatory Budgeting, Results, Cycle 7 https://council.nyc.gov/pb/results/cycle-7-results/, accessed on January 6, 2026). The dataset included 302 project proposals, of which three were excluded due to unclear cost specifications. Among the remaining 299 projects, 120 were selected for funding.
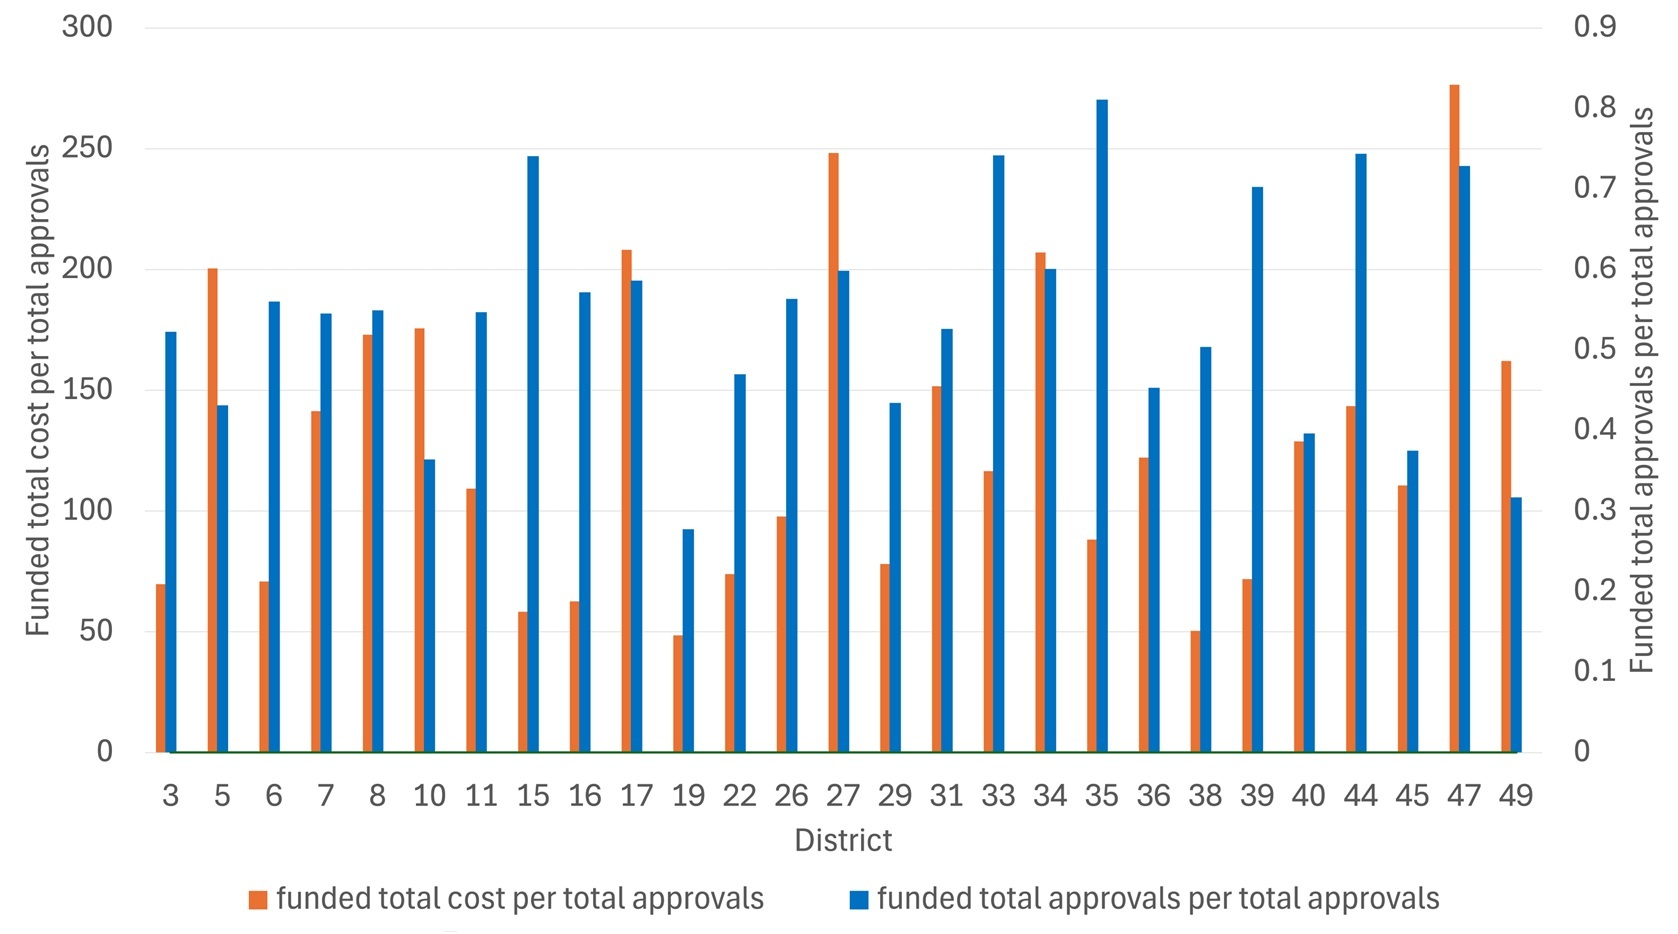
The orange bar chart in Figure 1 shows that there is a substantial variation across districts in the “funded total cost per total approvals” metric. While a district’s budget generally correlates with the funded total cost, and its population correlates with the total votes, these disparities should not be interpreted solely as evidence of systemic regional inequality. The quality of proposed projects also plays a crucial role in shaping voter approval.
The blue bar chart in Figure 1 illustrates the “funded total approvals per total approvals” metric for each district. This metric can be interpreted as a proxy for citizen satisfaction, as it captures the proportion of community support that successfully translates into project implementation. However, it is crucial to note that this metric is highly sensitive to the total budget and the individual costs of proposed projects.
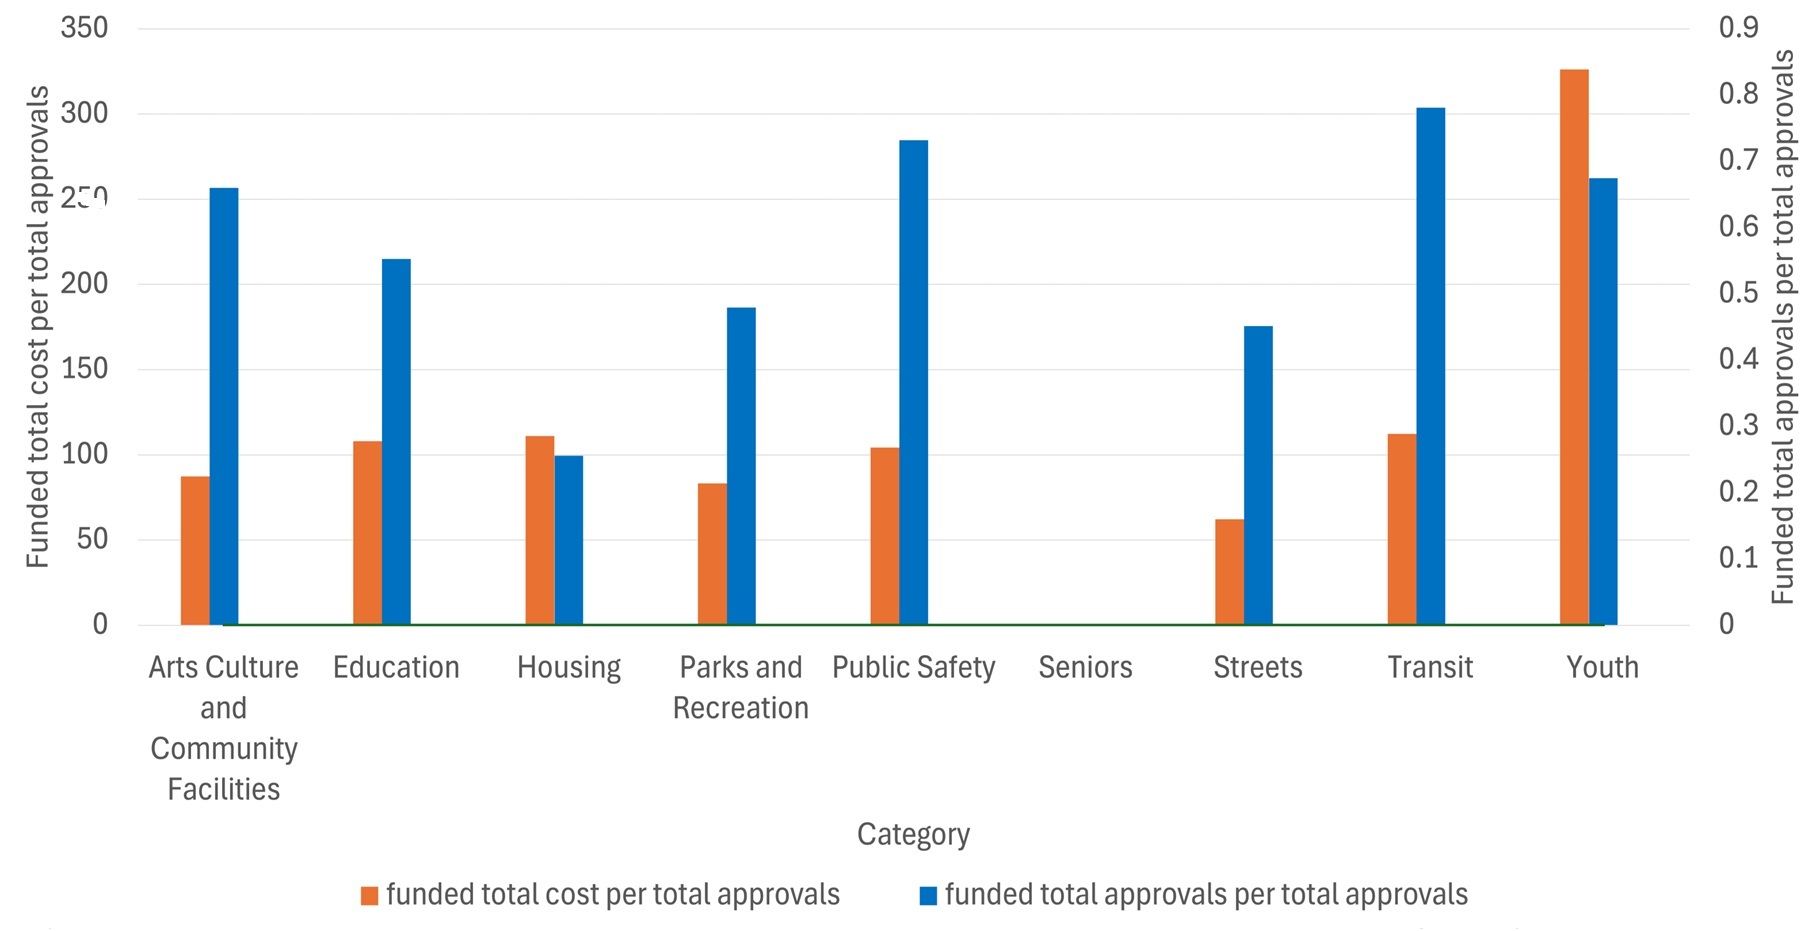
The orange bar chart in Figure 2 shows that the 'Youth' category accounts for a disproportionately large share of the “funded total cost per total approvals.” Many projects in this category are functionally similar to those in “Education,” suggesting a relatively high allocation of funding toward education-related initiatives. Such projects often feature relatively lower unit costs, which increases their likelihood of adoption.
Finally, the blue bar chart in Figure 2 shows no significant disparity across categories in the “funded total approvals per total approvals” ratio. Across New York City as a whole, the PB process maintains a balanced level of citizen satisfaction across project categories.
In conclusion, while the practical application of PB has increased significantly in recent years, theoretical research continues to examine which selection systems are normatively desirable. The extent to which these systems will be institutionalized in the future may depend heavily on the progress of academic research and the quality of submitted projects.
References
Goodin, R. (2008): Innovating Democracy: Democratic Theory and Practice After the Deliberative Turn, Chapter 6. https://doi.org/10.1093/acprof:oso/9780199547944.003.0006